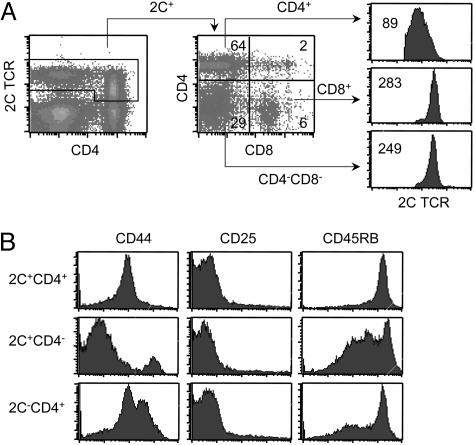
Fig. 4.
Surface phenotype of CD4+ 2C T cells in 2C+RAG+TAP−/− mice. (A) Lymph node cells of 2C+RAG+TAP−/− mice were analyzed for 2C TCR, CD4, and CD8. (Left) 2C TCR versus CD4 staining profile of all live cells. (Center) CD4 versus CD8 expression profile gating on 2C+ T cells. (Right) Comparison of 2C TCR levels among 2C+CD4+, 2C+CD8+, and 2C+CD4−CD8− T cells. Data from one representative mouse are shown. (B) Lymph node cells of 2C+RAG+TAP−/− mice were analyzed for 2C TCR, CD4, plus CD44, CD25, or CD45RB. The expression of CD44, CD25, and CD45RB is shown for 2C+CD4+, 2C+CD4−, and 2C−CD4+ T cells.

