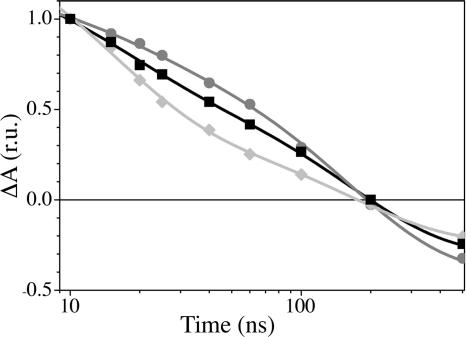
Fig. 2.
Decay of flash-induced absorption change at 380 nm (PhQ−), shown as a semilog plot. The solid lines are a fit of a biexponential decay function to the experimental data. WT, squares and black line; PsaA–Y696F, diamonds and light gray line; PsaB–Y676F, circles and dark gray line. r.u., relative units.

