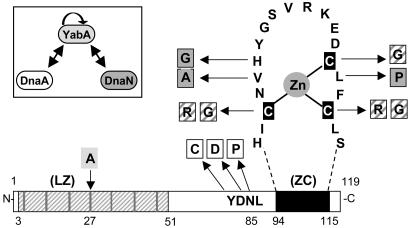
Fig. 2.
Mapping of DnaA- and DnaN-interacting mutants. Schematic representation of YabA with the predicted LZ and the potential ZC domains. The positions of the leucine residues in LZ are represented by gray bars. The Cs in the black boxes indicate the key cysteine residues in ZC. The letters correspond to amino acids in the one-letter code. Amino acid substitutions in YabA affecting the interaction with DnaA (white), DnaN (gray), both DnaA and DnaN (white and gray diagonals), and self-interaction (light gray) are indicated. A representation of the YabA-interacting partners used in this study is shown. Arrows represent interactions detected by the yeast two-hybrid assay and are oriented from bait to prey.

