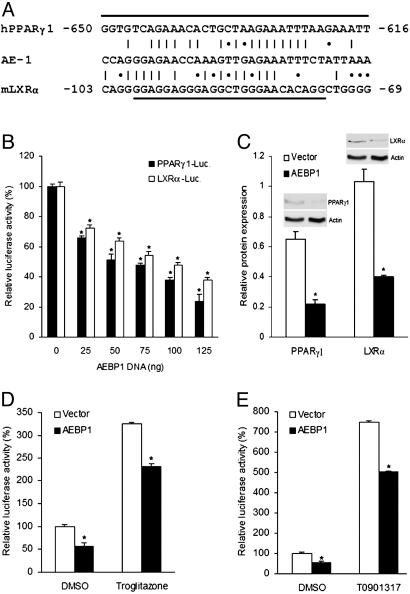
Fig. 1.
PPARγ1 and LXRα repression by AEBP1. (A) Sequence homology between AE-1 sequence and putative AEBP1-binding sequences within the promoter regions of mLXRα and hPPARγ1 genes. A vertical line represents an exact nucleotide match, and an asterisk represents a purine:purine or a pyrimidine:pyrimidine match. The underlined sequences are deleted in the pGL3–mLXRα–luciferase and pGL3–hPPARγ1–luciferase constructs, respectively. (B) The effect of AEBP1 on PPARγ1 and LXRα expression in CHO cells was assessed by luciferase assays. An empty vector was used to equalize the total amount of DNA transfected. (C) Densitometric analysis and immunoblotting of protein extracts obtained from transiently transfected CHO cells are shown. (D and E) Transcriptional activity of PPARγ1 (D) and LXRα (E) was assessed by luciferase assays by using PPRE–luciferase and LXRE–luciferase constructs, respectively. Statistical significance was determined relative to 0-ng AEBP1 transfection sample (B), empty vector (C), or DMSO treatment (D and E).

