Fig. 4.
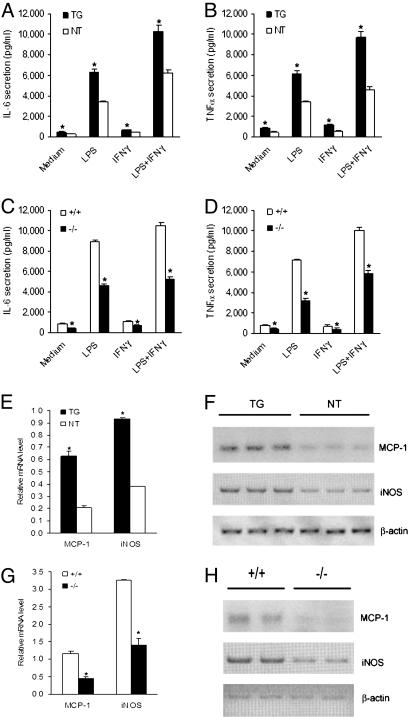
Enhanced macrophage inflammatory responsiveness by AEBP1. (A–D) ELISA was performed to evaluate the secretion of IL-6 (A and C) and TNF-α (B and D) by macrophages. (E–H) Semiquantitative RT-PCR was performed to assess MCP-1 and iNOS expression in AEBP1TG and AEBP1NT (E) and AEBP1+/+ and AEBP1−/− (G) macrophages. Histograms illustrating MCP-1 and iNOS mRNA levels in AEBP1TG and AEBP1NT (F) and AEBP1+/+ and AEBP1−/− (H) macrophages are shown. Statistical significance was determined relative to IL-6 and TNF-α secretion and MCP-1 and iNOS mRNA levels in AEBP1NT (A, B, and F) and AEBP1+/+ (C, D, and H) macrophages.

