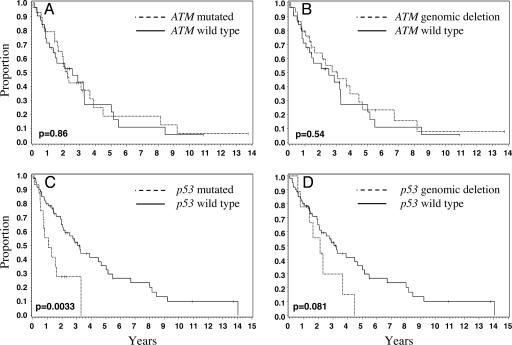
Fig. 1.
Overall survival by ATM and p53 mutational status. OS was estimated by the Kaplan–Meier method, and the log-rank test was used to estimate the difference in survival between groups. Here, mutated alleles refer to sequence changes not present in dbSNP, excluding silent changes. Solid black lines indicate cases with wild-type gene of interest, whereas dashed lines indicate cases with aberrations in the gene of interest. The median OS for each genotype is given in parentheses. (A) Mutated ATM (2.2 years) versus wild-type ATM (2.5 years); (B) deleted ATM (3.1 years) versus wild-type ATM; (C) mutated p53 (1.1 years) versus wild-type p53 (3.1 years); and (D) deleted p53 (2.1 years) versus wild-type p53.

