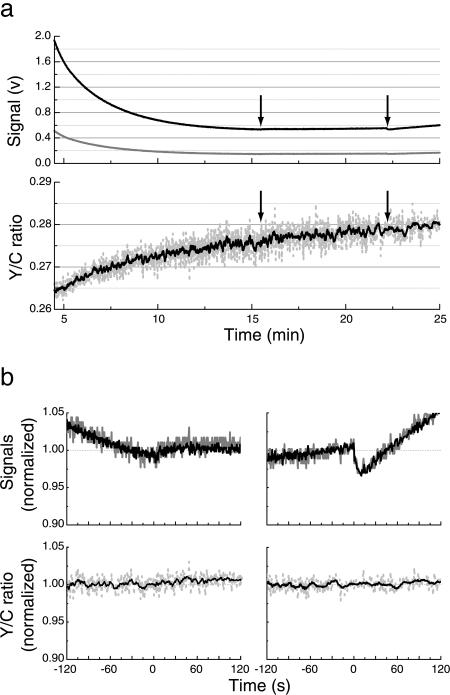
Fig. 2.
Negative controls. (a) Luminescence signals measured from flgE fliC cells (HCB1332) expressing RLUC. (Upper) The cyan (C) signal is shown in black and the yellow (Y) signal is shown in gray. (Lower) The Y/C ratio is shown in dashed gray with its 10-point running average overlaid in black. Forty microliters of reagents was delivered to the cuvette at the times indicated by arrows: first arrow, antibody in buffer; second arrow, α-methylaspartate (final concentration 0.1 mM). (b) Changes in individual signals (Upper, cyan in black, yellow in gray) compared with changes in their Y/C ratios (Lower, raw data in dashed gray, 10-point running average in black) shown on expanded scales. Time 0 is the time of addition of buffer (Left) or α-methylaspartate (Right). Cyan, yellow, and Y/C have been normalized to the mean value observed over the time span −10 to −40 s.

