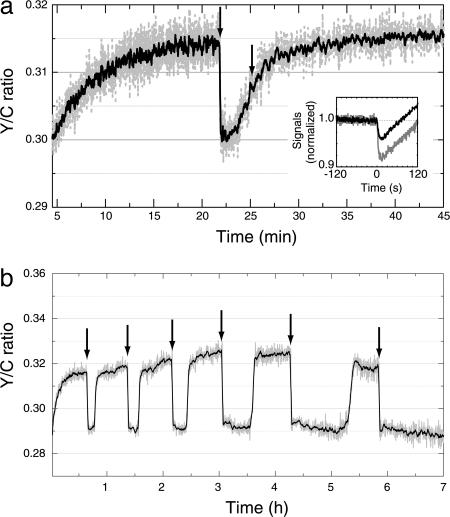
Fig. 3.
Chemotactic responses measured by BRET. As before, the Y/C ratio is shown in dashed gray and its 10-point running average in black. (a) Typical response in the Y/C ratio of cells competent for chemotaxis (VS104) expressing CheZ–RLUC and YFP–CheY to the addition of α-methylaspartate (first arrow, final concentration 1 mM) or antibody (second arrow). (Inset) The cyan and yellow signals after addition of α-methylaspartate are displayed as in Fig. 2b Upper. (b) Signal stability over long times. The response of cheR cheB cells (VS149) expressing CheZ–RLUC and YFP–CheY to doses of l-serine (final concentration 300 μM) applied at the times indicated by arrows. The recovery of the Y/C ratio after each addition of serine was caused by metabolic degradation of this attractant.

