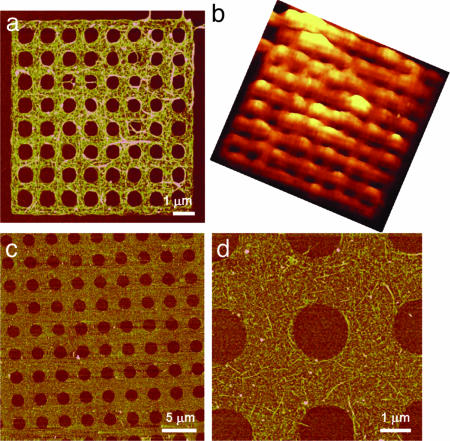
Fig. 5.
Proof-of-concept SWNT filtration membranes. (a) AFM topographic image of a SWNT membrane with 600 ± 50-nm-diameter pores spanning an area of 10 × 10 μm. (b) Corresponding Raman image showing SWNT spectroscopic signatures. The false color topography represents the integrated Raman intensity over 1,320–1,620 cm−1. (c and d) Representative AFM topographic images of a SWNT network with 1.6 ± 0.1-μm-diameter pores spanning an area of 1 × 2 cm. All AFM images were recorded at a scan rate of 0.5 Hz, and the height scales are 20 nm.

