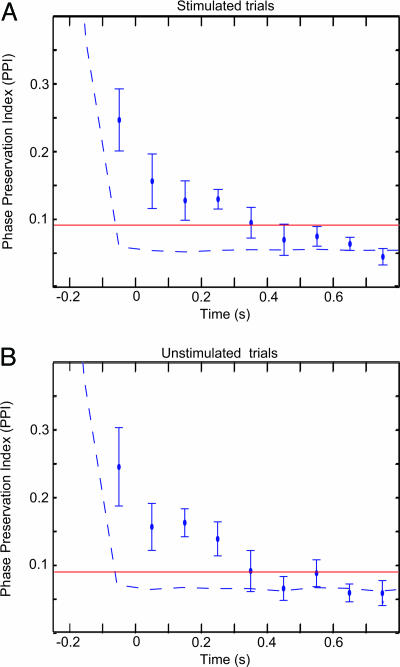
Fig. 4.
The PPI of the α oscillations. (A) The PPI across time averaged over eight subjects for the α frequency identified in individual subjects. Error bars indicate the SEM. The reference phase was determined at −0.25 s. The PPI decays slowly, showing that the poststimulus phases are preserved with respect to the prestimulus phase, up to ≈0.3 s poststimulus. PPI values above the red line are considered statistically significant (P < 0.01; see Methods). The dashed line indicates the PPI for trials shuffled in time (temporally uncorrelated). (B) The PPI for the unstimulated trials. The PPI values between the stimulated and unstimulated trials were not significantly different across time. (t test, P < 0.05).

