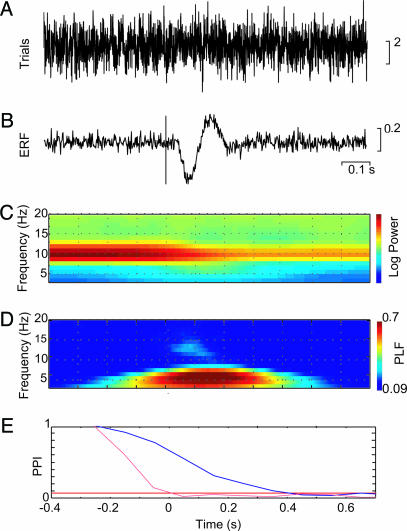
Fig. 6.
The model constructed to account for the experimental data. Each trial was composed of white noise, an ≈10-Hz sinusoid, and a time-locked component constructed from a damped 6-Hz sinusoid. The ≈10-Hz sinusoids varied in phase and slightly in frequency. (A) An example of one trial. (B) The evoked component generated from 500 trials. (C) The TFR of power of the trials showing the oscillatory α activity. (D) The PLF, demonstrating the contribution of the evoked component. (E) The PPI applied to the model data in the α (blue) and θ (red) bands.

