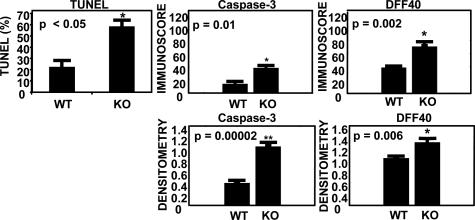
Fig. 4.
Analysis of apoptosis markers in kidney from bi-1−/− and bi-1+/+ mice. (Upper Left) TUNEL-positive nuclei were quantified in tissue sections from kidney of bi-1−/− (KO) and bi-1+/+ (WT) mice and expressed as a percentage of total nuclei counted (mean ± SD; n = 4). The histograms summarize the expression levels of active caspase-3 and cleaved DFF40 as determined by immunoscore (Upper Center and Upper Right) and immunohistochemical densitometry (Lower).

