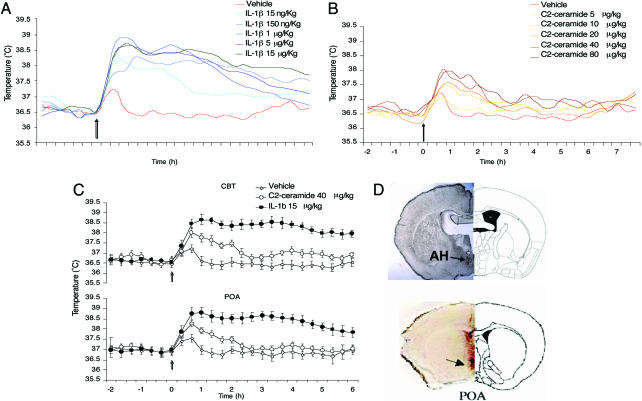
Fig. 1.
Dose–response curve for IL-1β and C2-ceramide on CBT after microinjection in the AH. (A) Dose–response curve for IL-1β-induced fever. CBT increased significantly at 60 min in IL-1β treated at 1, 5 and 15 μg/kg compared with IL-1β 15 ng/kg and 150 ng/kg or vehicle (∗, P < 0.05; data are averaged at 20-min intervals). (B) Dose–response curve for C2-ceramide-induced fever. CBT increased significantly at 40 min in C2-ceramide treated at doses 10, 20, 40, and 80 μg/kg (∗, P < 0.05, compared with vehicle). (C) Simultaneous recording of temperature in the POA and CBT comparing C2-ceramide 40 μg/kg, IL-1β 15 μg/kg, and vehicle control. C2-ceramide-induced rise in CBT peaks at 40 min, whereas the maximum rise in CBT caused by IL-1β peaks at 60 min. The effect of C2-ceramide declines after 60 min, reaching the baseline at ≈2 h, whereas the IL-1β-induced rise in CBT at 60 min remains at a constant level for the following 3 h, after which it declines but is significantly above the baseline (8–12 h) after injection. (A–C) All data points are from six animals each. (D) Location of cannulae aiming the AH and track of the thermisor to the POA; see arrows. Slices correspond to anterior–posterior coordinates from Bregma, −0.46 for AH and 0.38 for POA.

