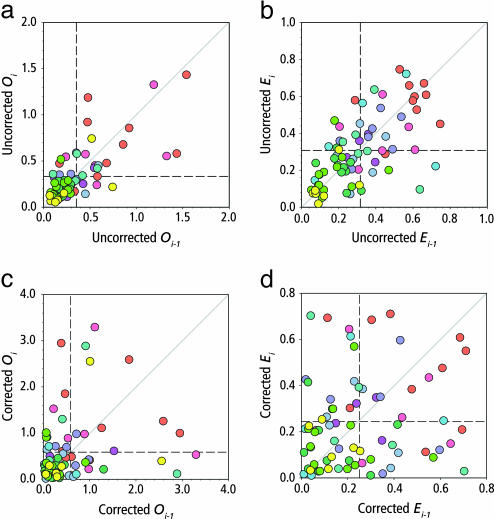
Fig. 2.
Correcting for the incompleteness of the fossil record causes autocovariance within origination, and within extinction, to disappear. Scatter plots of origination Oi−1 in a given interval vs. origination in the following interval Oi are presented for Sepkoski’s uncorrected (a) and corrected (c) data. Similar scatterplots of extinction are presented for uncorrected (b), and corrected (d) data. Boundary-crossers with pulsed turnover are used in all panels. Color coding corresponds to geologic time period, as in Fig. 1. Mean averages are indicated by black lines. The autocovariance present in the uncorrected data (a and b), manifest as the clumping of data points around the gray line of slope 1, disappears in the corrected data (c and d).

