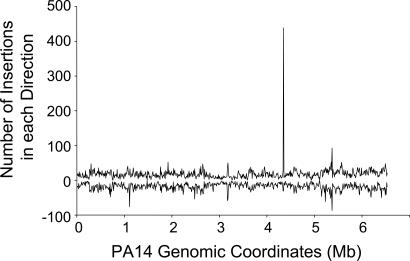
Fig. 3.
MAR2xT7 insertion-site distribution. The number of insertion sites in every 10 kb of PA14 genomic sequence. The upper set of data points represents insertions in which MAR2xT7 Strand B runs 5′ to 3′ with the top strand of the PA14 chromosome. The lower set of data points denotes MAR2xT7 insertions oriented in the opposite direction. Mb, megabase.

