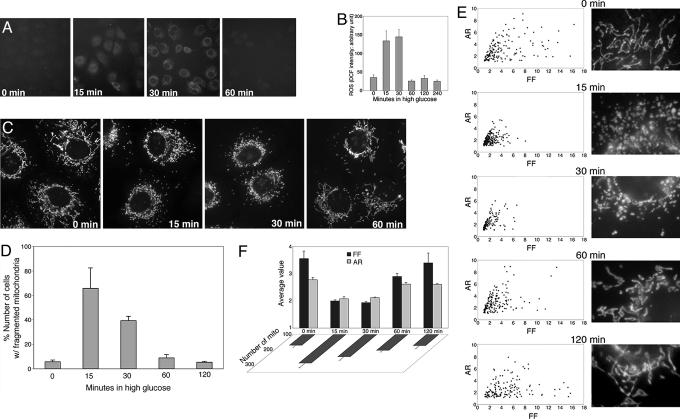
Fig. 1.
HG-induced ROS increase coincides with mitochondrial fragmentation. (A and B) HG incubation transiently increased ROS production. ROS was measured by oxidation of carboxy-dichlorodihydrofluorescein diacetate (Carboxy-DCF) at different times after HG incubation. Experiments were repeated more than five times and produced consistent results. Representative fluorescence quantification is shown in B. (C–F) Mitochondrial fragmentation in HG incubation. Clone 9 cells, whose mitochondria were labeled with red fluorescent protein, were incubated in 25 mM glucose. (C) Fragmented mitochondria were prevalent after 15 and 30 min in HG and normal tubular mitochondria after 60 min. (D) Cell counting is shown. (E) Analyses of mitochondrial morphology by form factor and aspect ratio. (E Left) Graphs plotted for form factor and aspect ratio of individual mitochondria in one cell are shown. (E Right) Enlarged images of a part of the corresponding cell used for the analysis, showing detailed mitochondrial morphology. (F) Average values of form factor and aspect ratio, as well as number of mitochondria, from five cells at each time point show transient fragmentation of mitochondria after incubation in HG conditions.

