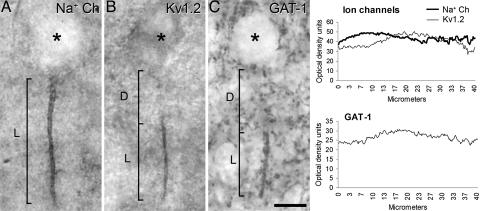
Fig. 1.
Distribution of Na+ and K+ voltage channels in the AIS of pyromidal cells and their relationship with Ch-terminals. (A and B) Photomicrographs showing the AIS of pyramidal cells from the human temporal neocortex immunostained for VGSC (A) and Kv1.2 (B). (C) Photomicrograph showing a GAT-1-ir Ch-terminal. In A and B, L indicates how the length of the VGSC- and Kv1.2-ir AIS was measured, respectively. In C, L indicates the length of the GAT-1-ir Ch-terminal. D indicates the distance from the base of the pyramidal cell body to the beginning of the AIS labeled for Kv1.2 (B) or to the GAT-1-ir Ch-terminal (C). The asterisks indicate the location of pyramidal cell bodies. (Scale bar: 10 μm.) (C Right) The plots shown are presented as a function of the mean distance from the cell body based on optical density readings of the immunostaining for Na+ and Kv1.2 channels along the AIS (Upper) or for GAT-1 Ch-terminals (Lower). Note that immunostaining for the VGSC is present along the whole length of the AIS, whereas for Kv1.2, the staining is restricted to the distal region of the AIS that is contacted by GAT-1-ir Ch-terminals (See Fig. 3 D–F).

