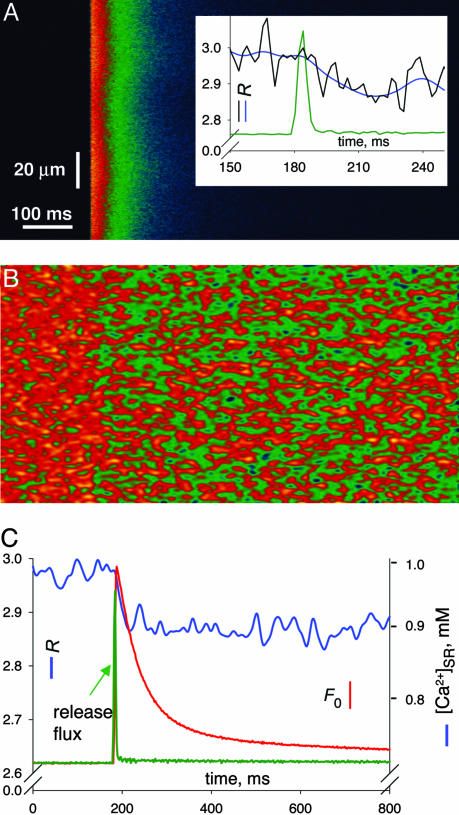
Fig. 3.
SR depletion upon an action potential. (A and B) Averages of six line-scan images from a skinned frog fiber. (A) F3(x, t) normalized to its average before the stimulus. Inset shows profiles in expanded scale. The blue trace shows R(t) from C. The black trace shows R(t) calculated after minimal filtering to show the slow onset of depletion. (B) Average of corresponding R images. (C) profiles F3(t) (red trace) or R(t) (blue trace) averaged over x. [Ca2+] scale calculated from equation 1 of ref. 11. The green trace shows the time course of release flux derived from F3 in arbitrary units.

