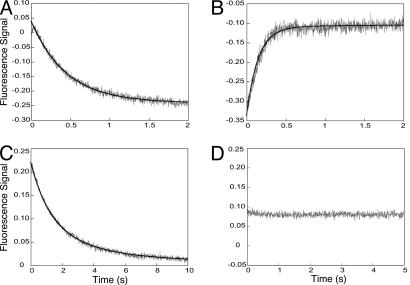
Fig. 4.
Stopped-flow fluorescence traces of mixing RFC versus PCNA-WCad in the presence of ATP (A), RFC-PCNA-WCad complex formed in the presence of ATP versus DNA bound with streptavidin (B), RFC versus PCNA-WCad in the presence of ATPγS (C), and RFC-PCNA-WCad complex formed in the presence of ATPγS versus DNA–streptavidin (D). The solid line represents the best fit of the trace to the exponential equations, as described in Results.

