Fig. 3.
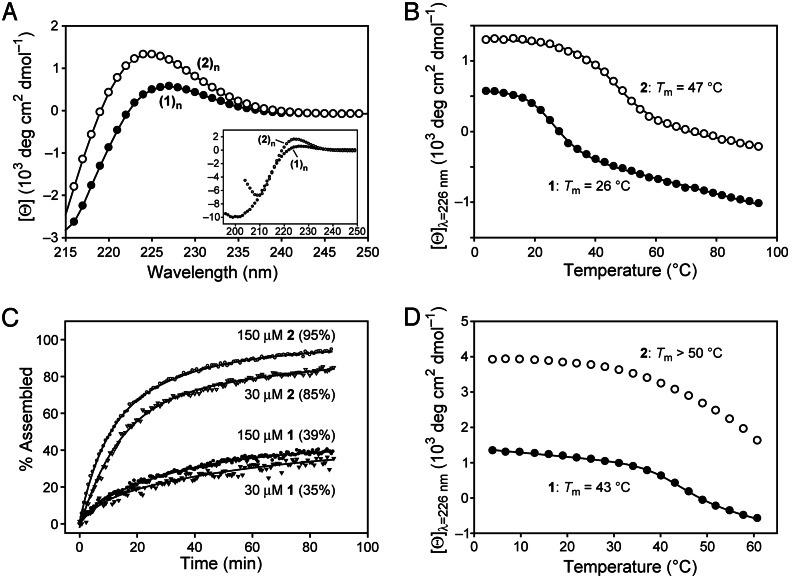
CD data for assemblies of fragments 1 and 2. (A) Spectra of assembled 1 and 2 (200 μM) at 4°C. (Inset) 1, 70 μM; 2, 100 μM. (B) Thermal denaturation of assembled 1 and 2 (200 μM), monitored at 226 nm. (C) Rate of assembly of fragments 1 and 2 (30 and 150 μM), over 90 min, monitored at 226 nm after a rapid transition from 90°C to 10°C. The [Θ]max for each sample was calculated as the difference between the ellipticity before denaturation (100% assembled) and the first data point at 10°C, thus omitting the initial jump in ellipticity (which was not resolvable) (47). The value of percent assembled was then calculated as the ratio of the observed recovery to [Θ]max. Data in A–C were from solutions in 50 mM HOAc(aq) at pH 2.9. (D) Thermal denaturation of assembled 1 and 2 (200 μM) in 67:33 MeOH/68 mM HOAc(aq) monitored at 226 nm.

