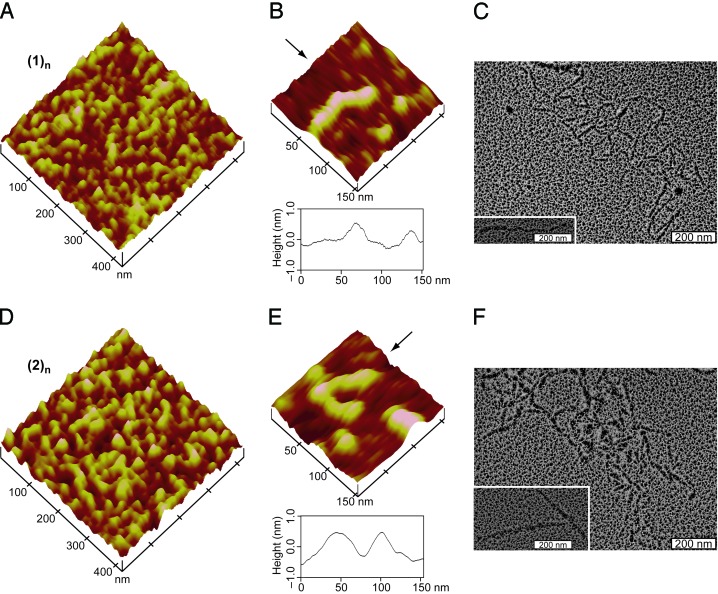
Fig. 4.
AFM and TEM images for assemblies of fragments 1 and 2. (A) AFM height image of (1)n. (B) AFM height image of isolated (1)n (Upper) and section analysis of the data along the direction indicated by the arrow (Lower). (C) TEM image of (1)n after rotary shadowing with platinum. (Inset) An isolated fibril. (D) The same as A, except for (2)n. (E) The same as B, except for (2)n. (F) The same as C, except for (2)n.

