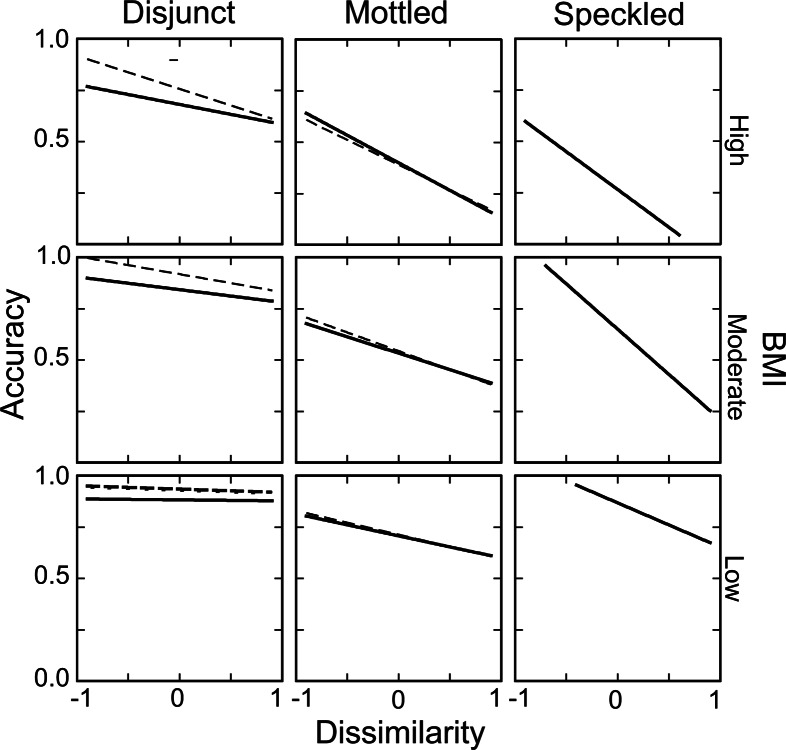
Fig. 4.
Detection accuracy in blocks of 100 trials as a function of the matching index of the target moth and the dissimilarity between the target and the last previous correctly detected moth. Matching index increases from the bottom to the top, dividing the range of indices within each treatment into percentile groupings: low (0–33rd), medium (34–66th), and high (67–100th). Regression lines indicate the relationship between accuracy and dissimilarity within matching index groupings. Solid lines show results from trials in which both the target moth and the previous one occurred on the same patch type; dashed lines indicate results from moths occurring on different patch types.

