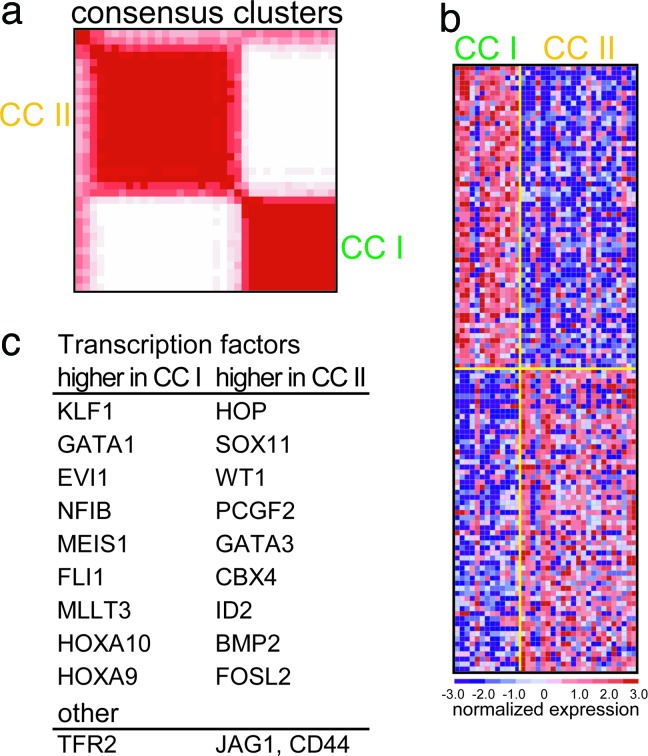
Fig. 4.
Identification of consensus cluster in non-DS-AMKL. (a) Consensus matrix produced by hierarchical clustering (K = 2). The samples are listed in the same order on the x and y axis. The intensity of the red color of the square for each sample combination corresponds to the frequency the samples cluster together in the iterations of dataset perturbation. Cluster I (CC I), 13 samples; Cluster II (CC II), 23 samples. (b) Expression profiles of the two AMKL clusters. The top 60 genes associated with each AMKL clusters are shown. Color scale at bottom indicates relative expression to the median. Red, high-level expression; blue, low-level expression. (c) List of selected genes (complete data in Table 8, which is published as supporting information on the PNAS web site).

