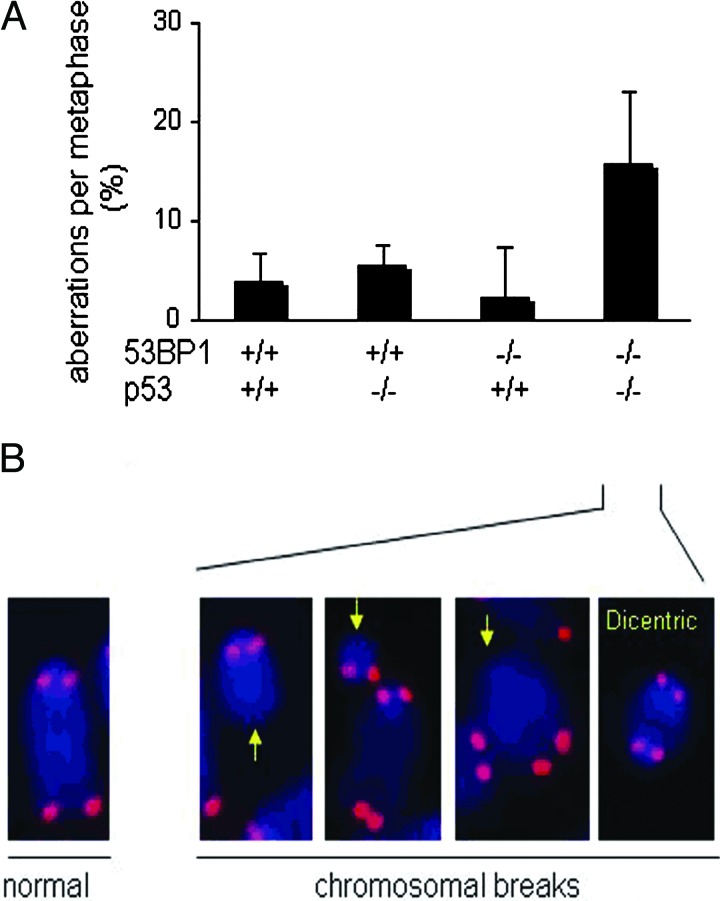
Fig. 4.
Increased genomic instability in 53BP1−/−/p53−/− thymocytes. (A) Quantification of structural chromosomal aberrations in Con A-stimulated T cells from wild-type (n = 4), p53−/− (n = 3), 53BP1−/− (n = 7), and 53BP1−/−/p53−/− (n = 3) mice. Of the three p53 mutants analyzed, two were derived from Donehower and colleagues (18, 19), and the third was from Jacks and colleagues (20). Metaphase spreads were hybridized with a telomere-specific Cy3-labeled PNA probe (red) to visualize the four ends of each chromosome and counterstained with DAPI (blue). At least 30 metaphases per culture were analyzed. Aberrations are represented as follows: % aberrations per metaphase = (total number of aberrations/total number of metaphases) × 100. (B) Partial metaphase spreads of 53BP1−/−/p53−/− T cells showing three chromosomal breaks (yellow arrows) and a dicentric resulting from rejoining of two broken chromosomes. A normal chromosome with four telomere signals is shown on the left for comparison.

