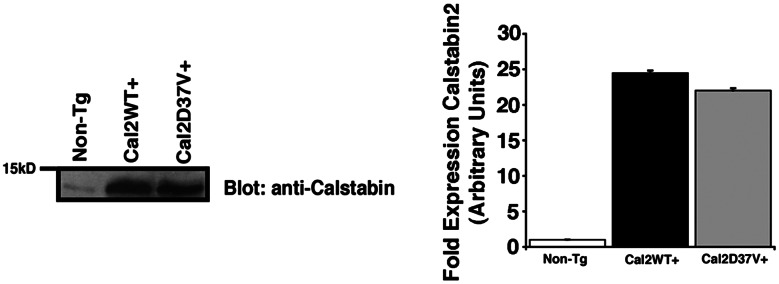
Fig. 5.

Murine models of cardiac-specific calstabin2 expression. Immunoblots show that WT expressers had ≈25-fold more calstabin2 than native mouse heart, and calstabin2–D37V+ Tg mice expressed ≈22-fold more calstabin2–D37V. The bar graph shows quantification of the immunoblots by using densitometry.
