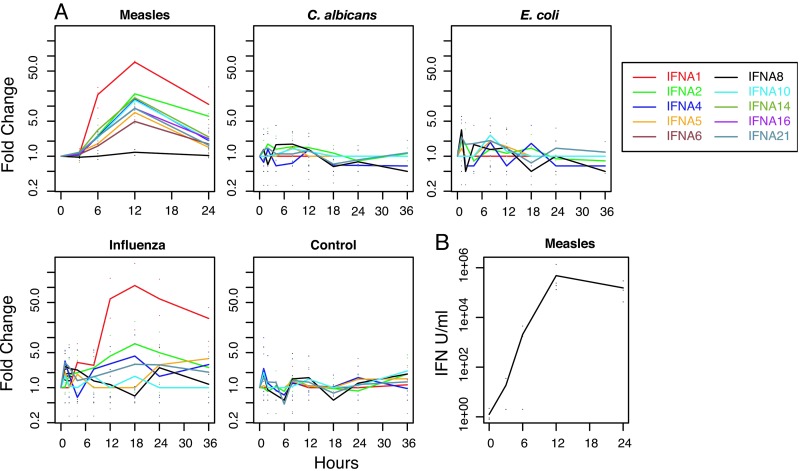
Fig. 1.
Induction of IFN-α genes. (A) IFN-α gene expression. Time course of IFN-α gene expression for DCs exposed to MV, C. albicans, E. coli, influenza virus, or media. RNAs were collected at various time points, and expression levels were measured by microarray analysis. The lines show the mean fold changes normalized to the preexposure 0 time point, and the points show the actual fold changes. Data for C. albicans, E. coli, and influenza virus are from Huang et al. (15). (B) Production of biologically active IFN by MV-infected DCs. Points show the calculated IFN units per milliliter for the replicates and the line shows the means.

