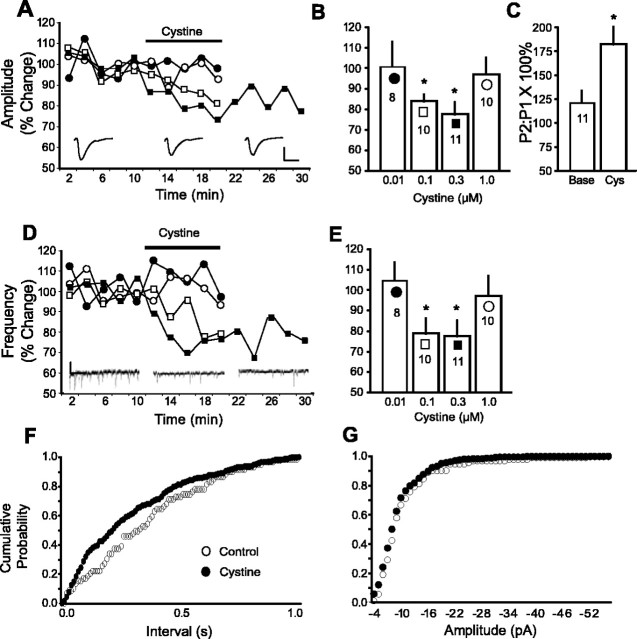
Figure 2.
Cystine inhibition of excitatory transmission is concentration dependent. A, Evoked EPSCs were normalized to the average of baseline (2-10 min) and are shown as mean percentage change. Legend and n at each dose are shown in B. Cells in the 0.3 μm group were exposed to a wash period (22-30 min). Representative traces are from a single cell during baseline, cystine, and wash. Calibration: 60 pA, 10 ms. B, Data presented in A are presented as mean ± SEM percentage change from baseline (samples 8-10) by cystine (samples 18-20). Symbols correspond to A, and n at each dose is shown below the symbol. C, Cells exposed to 0.3 μm cystine (Cys) exhibit enhanced paired-pulse facilitation. The data are expressed as a percentage change in the ratio of the second response to the first. D, Normalized sEPSC during baseline and cystine. See E for legend and n at each concentration of cystine. A representative 1 s current trace from a single cell after 10 min of baseline, cystine (0.3 μm), and wash is shown. Calibration: 20 pA, 200 ms. E, Data in D presented as mean ± SEM percentage change from baseline (samples 8-10) by cystine (samples 18-20). Symbols corresponding to D and n at each dose are shown below the symbol. F, The distribution of time intervals between successive sEPSC during baseline (10 min) and cystine (20 min). G, Distribution of sEPSC amplitude during baseline (10 min) and cystine (20 min). The asterisk denotes a significant difference from baseline (p ≤ 0.05).

