
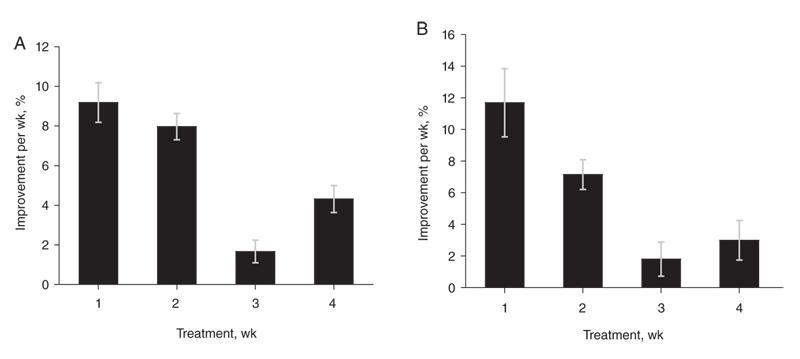
Fig. 3: Response to antipsychotic treatment over time after removal of the placebo effect. (A) Mean (and standard error [SE]) weekly overall clinical improvement (p < 0.001). (B) Mean (and SE) weekly change in core psychotic symptoms (p = 0.08). The p values are for the main effect of time. The error bars represent standard error. Figure reproduced with permission from the American Medical Association (Arch Gen Psychiatry 2003;60:1228-3538).