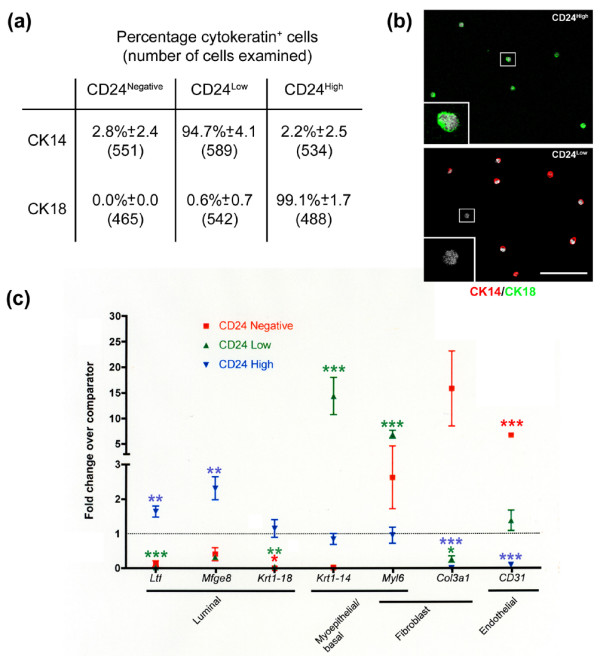
Figure 2.

Characterisation of CD24High, CD24Low and CD24Negative populations. (a) Cell populations sorted on the basis of CD24 expression were stained for cytokeratin (CK)8/18 or CK14. The mean percentage of CK14 and CK8/18 positive cells (±standard deviation) and the total number of cells counted is indicated for each population. Results from four independent sorts. (b) Cells were double stained with CK14 and CK8/18. Only CK18+/CK14- cells were observed in the CD24High population (top panel). The majority of CD24Low cells were CK14+, with occasional CK18-/CK14- cells (bottom panel, inset). No CK18+/CK14+ cells were observed. Scale bar = 75 μm. (c) Quantitative rtPCR reactions were carried out to determine fold changes in expression of a selection of genes with known luminal epithelial (Ltf, Mfge8, Krt1-18), myoepithelial/basal (Krt1-14, Myl6a) or non-epithelial (Myl6a, Procollagen 3a1 (Col3a1), CD31) distribution, compared to leucocyte-depleted, bulk mammary cells. The analysis was carried out on two independent cDNA syntheses from each of three independent sorts (CD24Low and CD24High) or on two independent cDNA syntheses from one sort and a single cDNA synthesis from a pool of two further sorts (CD24Negative). Significance levels are indicated by: *P < 0.05; **P < 0.01; ***P < 0.001.
