
Figure 2.
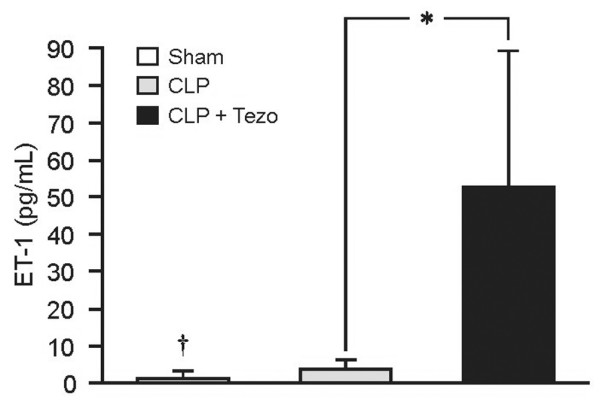
Plasma concentrations of endothelin-1 (ET-1) in rats determined 12 h after surgical interventions. Data are presented as mean ± SEM. Sham, sham-operated group (n = 5); CLP, cecum ligation and puncture group (n = 7); CLP+Tezo, cecum ligation and puncture + tezosentan group (n = 7). *p < 0.05 between CLP and CLP+Tezo groups; †p < 0.05 between Sham and CLP groups.