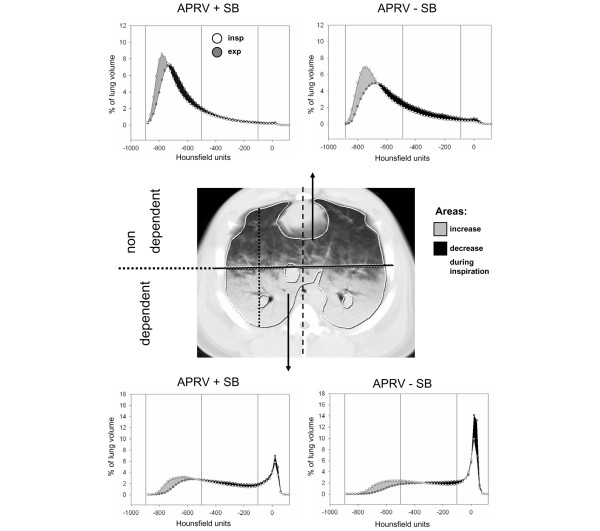
Figure 1.

Densitometries of dynamic lung computed tomography (CT). Center, example of an end-expiratory transverse CT scan of a slice close to the diaphragm. External boundaries of the lungs inside the ribs and the internal boundaries along the mediastinal organs were marked. The marked lung tissue was divided into a nondependent and a dependent region of interest bisecting a ventral to dorsal axis that represents the highest chest diameter in parallel to a reference line from sternum to spine. Upper and lower parts, densitometric analyses of all dependent and nondependent lung regions close to the diaphragm computed from dynamic CT at end-expiration and end-inspiration. Histograms show the normalized lung volume for Hounsfield units ranging from -1,000 to 100, plotted as means of all animals. Aeration categories (hyperinflated, normally aerated, poorly aerated, nonaerated; see text for details) are marked. Gray areas indicate increase during inspiration, black areas show decrease during inspiration.
