
Figure 1.
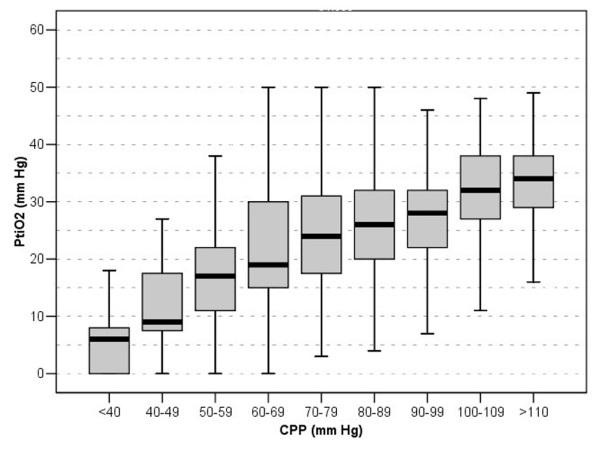
Brain tissue oxygen pressure (PtiO2) versus cerebral perfusion pressure (CPP). This box-and-whisker plot shows the relationship between PtiO2 and CPP. The median, the lower quartile and the upper quartile, and the lowest and highest values in the distribution of samples (N = 1,672 hourly snapshot samples) are represented by the black horizontal bar, the upper and lower end of each box, and the upper and lower end of its error bars, respectively.