
FIGURE 2.
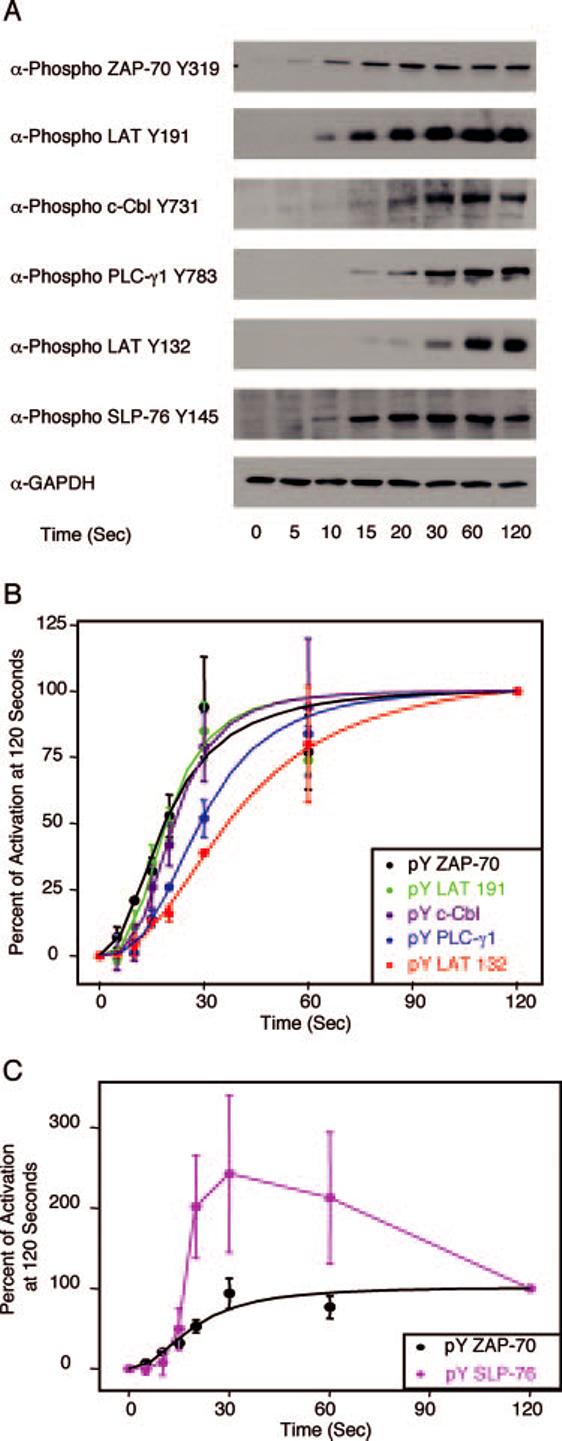
Phosphorylation kinetics of various signaling proteins in E6.1 Jurkat cells. E6.1 Jurkat cells were treated with or without anti-CD3 for various times and the cellular proteins were separated by PAGE. A, The tyrosine phosphorylation of specific sites on ZAP-70, LAT, c-Cbl, PLC-γ1, and SLP-76, along with the expression level of GAPDH, was determined by immunoblotting as described in Materials and Methods. B, The percent activation at 120 s for ZAP-70, LAT, c-Cbl, and PLC-γ1 was determined as described in Materials and Methods. The mean ± SEM of three separate experiments for each time point was plotted and fit using Origin. C, The percent activation at 120 s for ZAP-70 and SLP-76 were determined. The mean ± SEM of three separate experiments for each time point was plotted. A sigmoidal curve for the ZAP-70 data was fit using Origin.