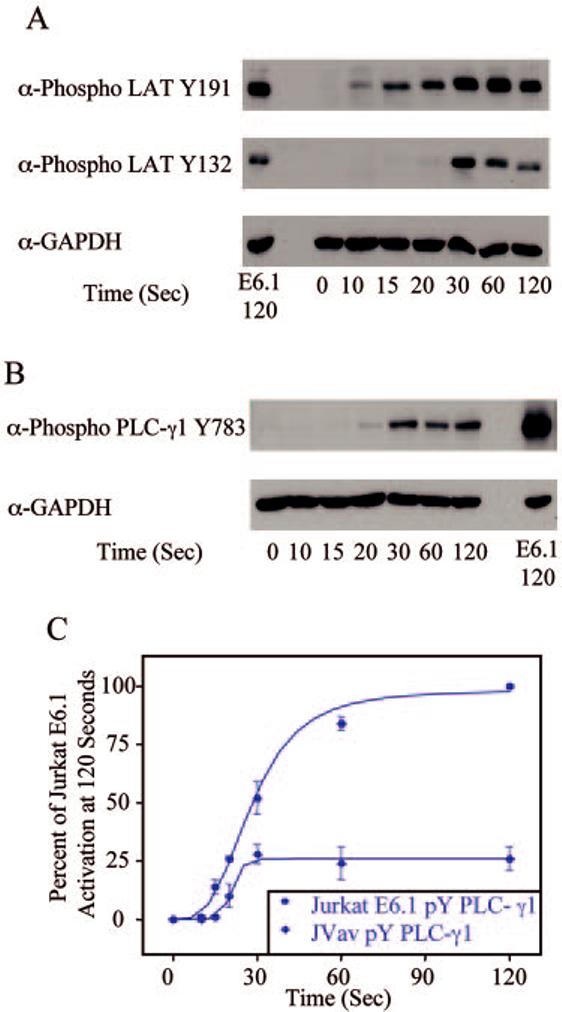
FIGURE 7.

Phosphorylation kinetics of various signaling proteins in JVav Jurkat cells. JVav Jurkat cells were treated with or without anti-CD3 for various times and the cellular proteins were separated by PAGE. A, The tyrosine phosphorylation of specific sites on LAT, along with the expression level of GAPDH, was determined by immunoblotting. For comparison, the phosphorylation of these proteins and the expression level of GAPDH in E6.1 Jurkat cells treated with anti-CD3 for 120 s are shown. B, The phosphorylation of PLC-γ1, along with the expression level of GAPDH, was determined by immunoblotting. For comparison, the phosphorylation of PLC-γ1 and the expression level of GAPDH in E6.1 Jurkat cells treated with anti-CD3 for 120 s are shown. C, The percent activation of E6.1 Jurkat cells at 120 s for PLC-γ1 in E6.1 and JVav Jurkat cells was determined. The mean ± SEM of three separate experiments for each time point was plotted and fit using Origin.
