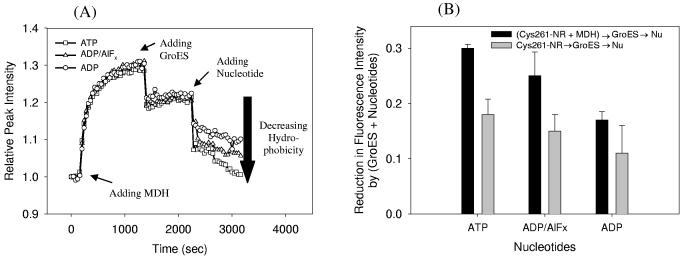
FIGURE 5.
(A) Kinetic measurements of the relative peak fluorescence intensity of Cys261-NR induced by the addition of denatured MDH, GroES and different nucleotides. The fluorescence intensity at maximum was monitored as a function of time, 10 s per point. MDH was added first, then GroES, and finally various nucleotides (ATP (open rectangles), ADP (open circles), or ADP/AlFx (open triangles)). Five additional analogous experiments with different sequences of adding MDH, GroES and nucleotide were also performed to observe the sequence dependence (see text). (B) Comparison of fluorescence reductions by (GroES + nt) for the two sequences of MDH-ES-nt (black bars), and ES-nt (gray bars) in the same units of part (A).

