
Figure 4.
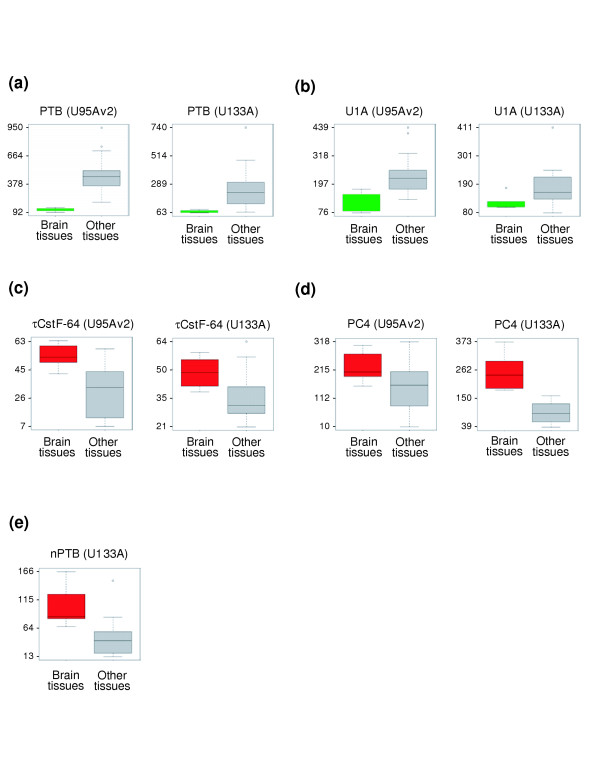
Boxplots of mRNA expression of several factors in brain and other tissues. (a) PTB, (b) U1A, (c) τCstF-64, (d) PC4, and (e) nPTB. All factors except nPTB were present in both the U95Av2 and U133A datasets. Brain tissues include amygdala, thalamus, caudate nucleus, fetal brain, and whole brain. Expression values lower in brain tissues than other tissues are in green; and those higher in brain tissues are in red.