
FIG. 11.
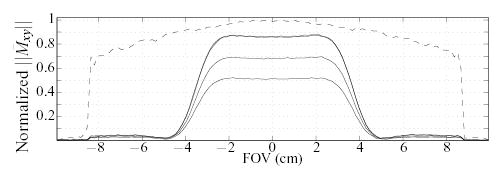
Plot of signal measured by the 2DRF-CPMG sequence at the 1st, 2nd, 8th, and 16th echoes, along a line passing through the center of the sample (solid lines). Dashed line represents signal measured by the HP-CPMG sequence at the 1st echo (coinciding in time with the 1st echo of the 2DRF-CPMG). Note the reduced 2DRF-CPMG signal at the 1st echo is due to the 60° flip angle of the 2D RF excitation.