
FIG. 9.
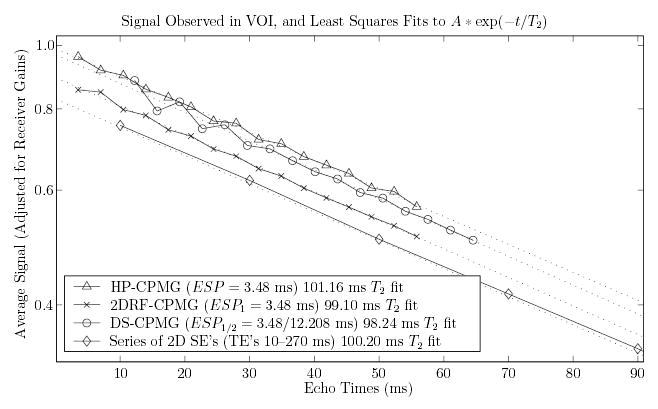
Comparison of signal decays observed by each CPMG imaging sequence within the VOI (solid lines), and T2 fits computed from these decays (dotted lines). A set of 14 acquisitions using a standard 2D Hahn SE sequence were also acquired for comparison, with TEs ranging from 10 to 270 ms at 20 ms increments (only the first 5 are within x axis extent and plotted).