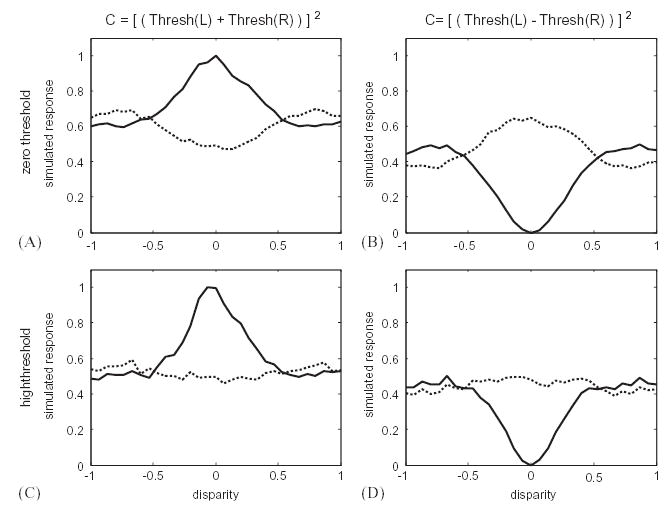
Fig. 6.

The reduced response to anti-correlated stimuli can be explained if the monocular inputs are thresholded before being combined. Solid lines show the response to ordinary, correlated random-dot patterns, dotted lines to anti-correlated patterns. There is far less modulation for the anti-correlated stimuli. The left-hand column (AC) shows a “tuned-excitatory”-type tuning curve (Poggio and Fischer, 1977), with a peak for a preferred disparity. For these cells, the reduced response to anti-correlated stimuli could also be explained with an output threshold, retaining the linear combination of left and right-eye inputs (Lippert and Wagner, 2001). However, this would not explain the reduced response in “tuned-inhibitory” cells like those on the right (BD), where the tuning curve has a central trough rather than a peak. Thresholds prior to binocular combination explain the reduced response in both types of disparity tuning (Read et al., 2002). In the top row (AB), the threshold is set at zero (half-wave rectification). If higher thresholds are used, the response to anti-correlated stimuli is suppressed further. The bottom row (CD) shows results from a simulation where the threshold was set so high that only 12% of random-dot patterns elicited a response from the monocular subunit (cf. 50% for a threshold at zero). In all simulations, the receptive fields are the same as for Fig. 4, and the curves show the mean response to 10,000 random-dot patterns at each disparity.
