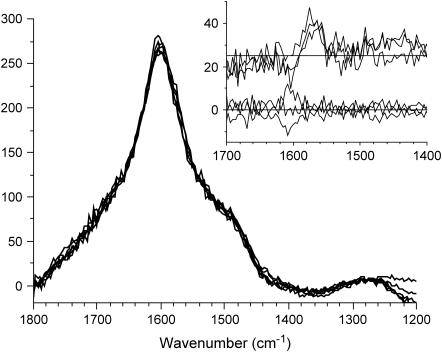
FIGURE 5.
RR spectra (λex = 500 nm) of three control and three enzyme-treated (300 units/g) beech cell dried samples normalized by integration from 1470 to 1740 cm−1. The inset shows their difference spectra ΔI = I − Iref. Iref is the average of the three beech control (normalized) spectra. The three spectra of enzyme-treated samples are displaced for clarity.

