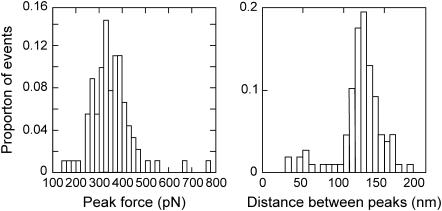
FIGURE 2 .
Histograms showing the distribution of peak forces (left) and distance between peaks (right) for the sawtooth curves recorded from the extracellular matrix of P. tricornutum. Note there are peaks that have much shorter or greater spacing; these occur within traces where the remainder of the peaks have normal spacing, i.e., ∼120 nm. These can be explained by either modular proteins that are misfolded, or that don't unfold evenly, due to interactions with surrounding fibers and/or diatom extracellular mucilage.

