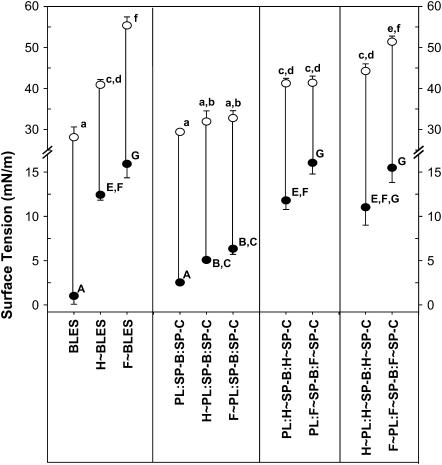
FIGURE 11.
Reconstitution studies. Effect of PL oxidation versus protein oxidation on minimum and maximum γs. Minimum (•) and maximum (○) γs reached by the samples during the 21st dynamic cycling. Samples are as in Fig. 9. The data are the average of three separate experimental samples. Comparisons among the samples were conducted by ANOVA followed by Bonferroni and Tukey post-hoc tests. Letters a–f and A–G represent comparisons among samples in Figs 11 and 12. Means with the same letter are not significantly different for p < 0.05.

