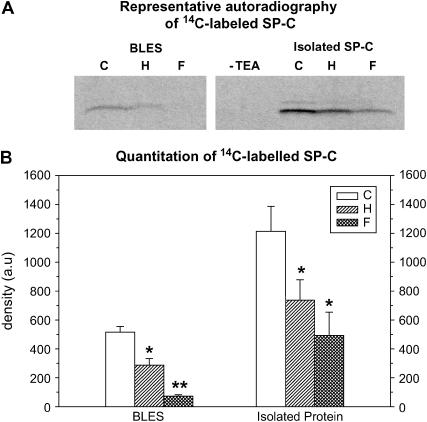
FIGURE 8.
SP-C palmitoylation. (A) Representative autoradiography of 14C-labeled SP-Cs obtained from BLES, H∼BLES, and F∼BLES, as well as isolated C∼SP-C, H∼SP-C, and F∼SP-C. After the reacted samples were separated by Tricine-SDS-PAGE and transferred to nitrocellulose, a [14C] SP-C-labeled band corresponding to palmitoylated SP-C was detected at 3.7 kDa. (B) Bar graph summarizing the relative amount of mature SP-C as determined by quantitation of [14C] SP-C bands with the software QuantiScan for Windows, BIOSOFT 99. Comparisons between two groups were made using paired Student t-test (*, p < 0.05; **, p < 0.01).

