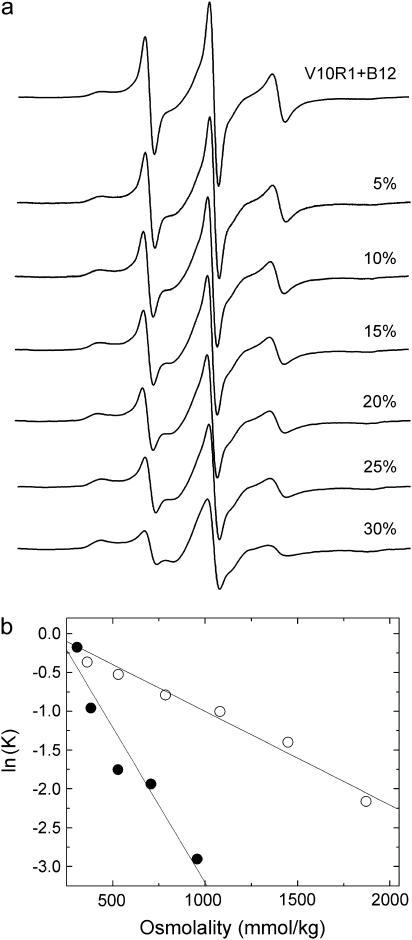
FIGURE 4.
Series of EPR spectra from V10R1 in the presence of substrate with the addition of 0% to 30% w/v PEG 400 to a buffer solution of 10 mM HEPES, 130 mM NaCl, pH 6.5. The decrease in amplitude reflects the conversion of the Ton box from an undocked to a docked (or trapped state). Also shown are plots of ln(K) versus osmolality obtained for V10R1 when either PEG 3350 (•) or PEG 400 (○) is used as the solute. The different slopes reflect different thermodynamic hydration volume changes probed by these solutes (see Table 1).

