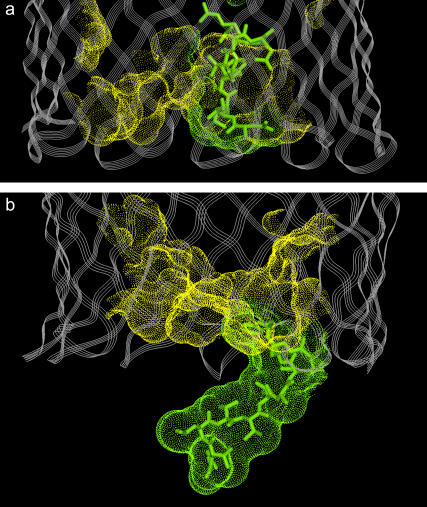
FIGURE 5.
Renderings of the solvent-exposed surface (Connolly surface) on the periplasmic end of BtuB for the hatch region (residues 6–135) of BtuB. Surface area for residues 6–15 is shown in green; surface area for residues 16–135 is shown in yellow. (a) The BtuB crystal structure in the Ca2+- and B12-bound state (Protein Data Bank ID 1NQH), and (b) a model of BtuB in the Ca2+- and substrate-bound state where the conformation of the Ton box is consistent with the results of SDSL (see Fig. 1 b) and unfolded from residues 6–15.

