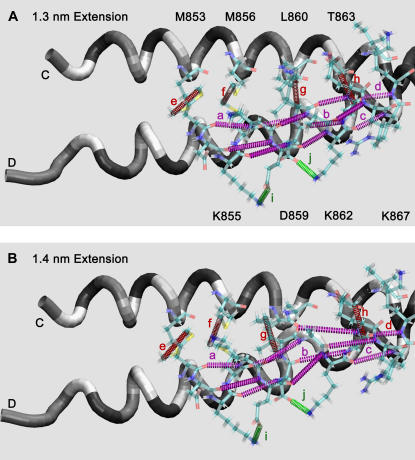
FIGURE 9.
Transformation of hydrogen bonds, hydrophobic interactions, and salt bridges near the N-terminal end of scallop S2 during stretching from (A) 1.3 nm to (B) 1.4 nm of extension. Hydrogen bonds: (a) M853_O:K857_N, (b) D859_O:T863_N, (c) K862_O:I866_N, (d) T863_O:K867_N, and others that are not labeled; intercoil hydrophobic interactions: (e) M853_Cɛ:M853_Cɛ:, (f) M856_Cɛ:M856_Cɛ, (g) L860_Cδ1:L860_Cδ1, (h) T863_Cγ2:T863_Cγ2; salt bridges: (i) K855_Nζ:E858_Oɛ2, (j) D859_Oδ:K862_Nζ. These are shown in the region between residues 853 and 863 as colored, dashed tubes between the interacting atoms. Notice large changes in the α-helical hydrogen bonds between the two panels. See Fig. 10 for details of how these interactions change with extension. The chains are shown as tubes colored as the type of residue: red, acidic; blue, basic; yellow, hydrophobic; green, polar.

