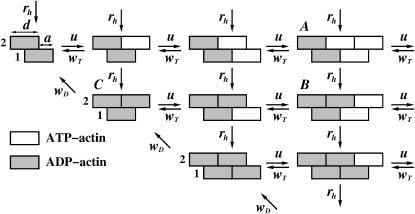
FIGURE 1.
Schematic picture of polymer configurations and possible transitions in the vectorial model of the single actin filament's growth. The size of the monomer subunit is d, while a is a shift between the parallel protofilaments equal to one-half of the monomer size. Two protofilaments are labeled 1 and 2. The transition rates and labels to some of the configurations are explained in the text.

