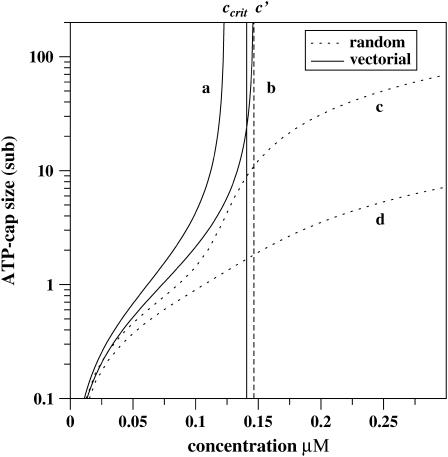
FIGURE 4.
The size of ATP cap as a function of free monomer concentration for the barbed end of the single actin filament within the vectorial (a and b) and the random (c and d) mechanisms of ATP hydrolysis. (Thick solid lines describe the vectorial mechanism, while dotted lines correspond to the random mechanism.) The kinetic parameters for constructing curves b and d are taken from Table 1. For the curves a and c, the kinetic rate constants are also taken from Table 1 with the exception of the smaller hydrolysis rate rh = 0.03 s−1. (Vertical dashed line and thin solid line indicate the transition point c′ and the critical concentration ccrit, respectively, for curve b.)

