
FIGURE 1.
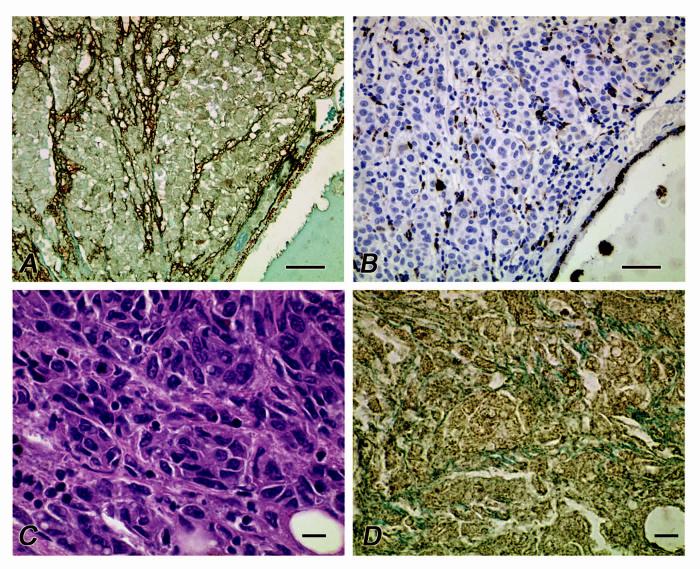
Distribution of osteopontin in primary and metastatic uveal melanoma. A. Osteopontin is distributed along looping vasculogenic mimicry patterns at the periphery of a primary uveal melanoma. Note the cytoplasmic staining of tumor cells and the absence of nuclear staining. B. Section adjacent to that illustrated in A., stained for CD68, a macrophage marker. Although macrophages are identified within vasculogenic mimicry patterns, the distribution of CD68-positive cells does not correspond to the diffuse staining of patterns seen when the tissue is labeled for osteopontin (A). C. Metastatic uveal melanoma to the liver. D. Section adjacent to C stained for osteopontin. Note the diffuse distribution of osteopontin in contrast with a primary uveal melanoma (A) and the presence of both nuclear and cytoplasmic staining. A, osteopontin counterstained with light green; B, CD68 counterstained with hematoxylin; C, hematoxylin-eosin, D. osteopontin counterstained with light green. Magnification bars: A, B = 50 μm; C,D = 10 μm.