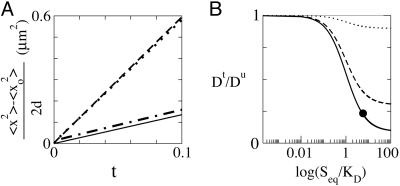
Fig. 2.
Effective diffusion coefficients. (A) (〈 x2 〉 − 〈 x02 〉)/(2d)vst (where d is the space dimension: d = 1 in the tagged-particle bolus simulation discussed in Fig. 1A, and d = 3 in the FRAP and particle deficit experiments discussed in Fig. 1C). The four lines shown are for Pfu + Pft (dashed) and Pft (dashed–dotted) in the tagged particle bolus simulation, Pfu in the particle-deficit simulation (dotted), and Pft in the FRAP simulation (solid). The slopes of these lines give the effective diffusion coefficients. (B) Dt/Du as a function of Seq/KD. The dotted line corresponds to Seq/ST = 0.9, the dashed line corresponds to Seq/ST = 0.3, and the solid line corresponds to Seq/ST = 0.1. For large Seq/KD, the ratio approaches its asymptotic value: Seq/ST. The black dot corresponds to the parameters used in all simulations in this report.

